- 2026-02-13
- posted by Htay Min Kaung
- System
How to create Gradient Charts using Chart JS ?
Good Day to you all !
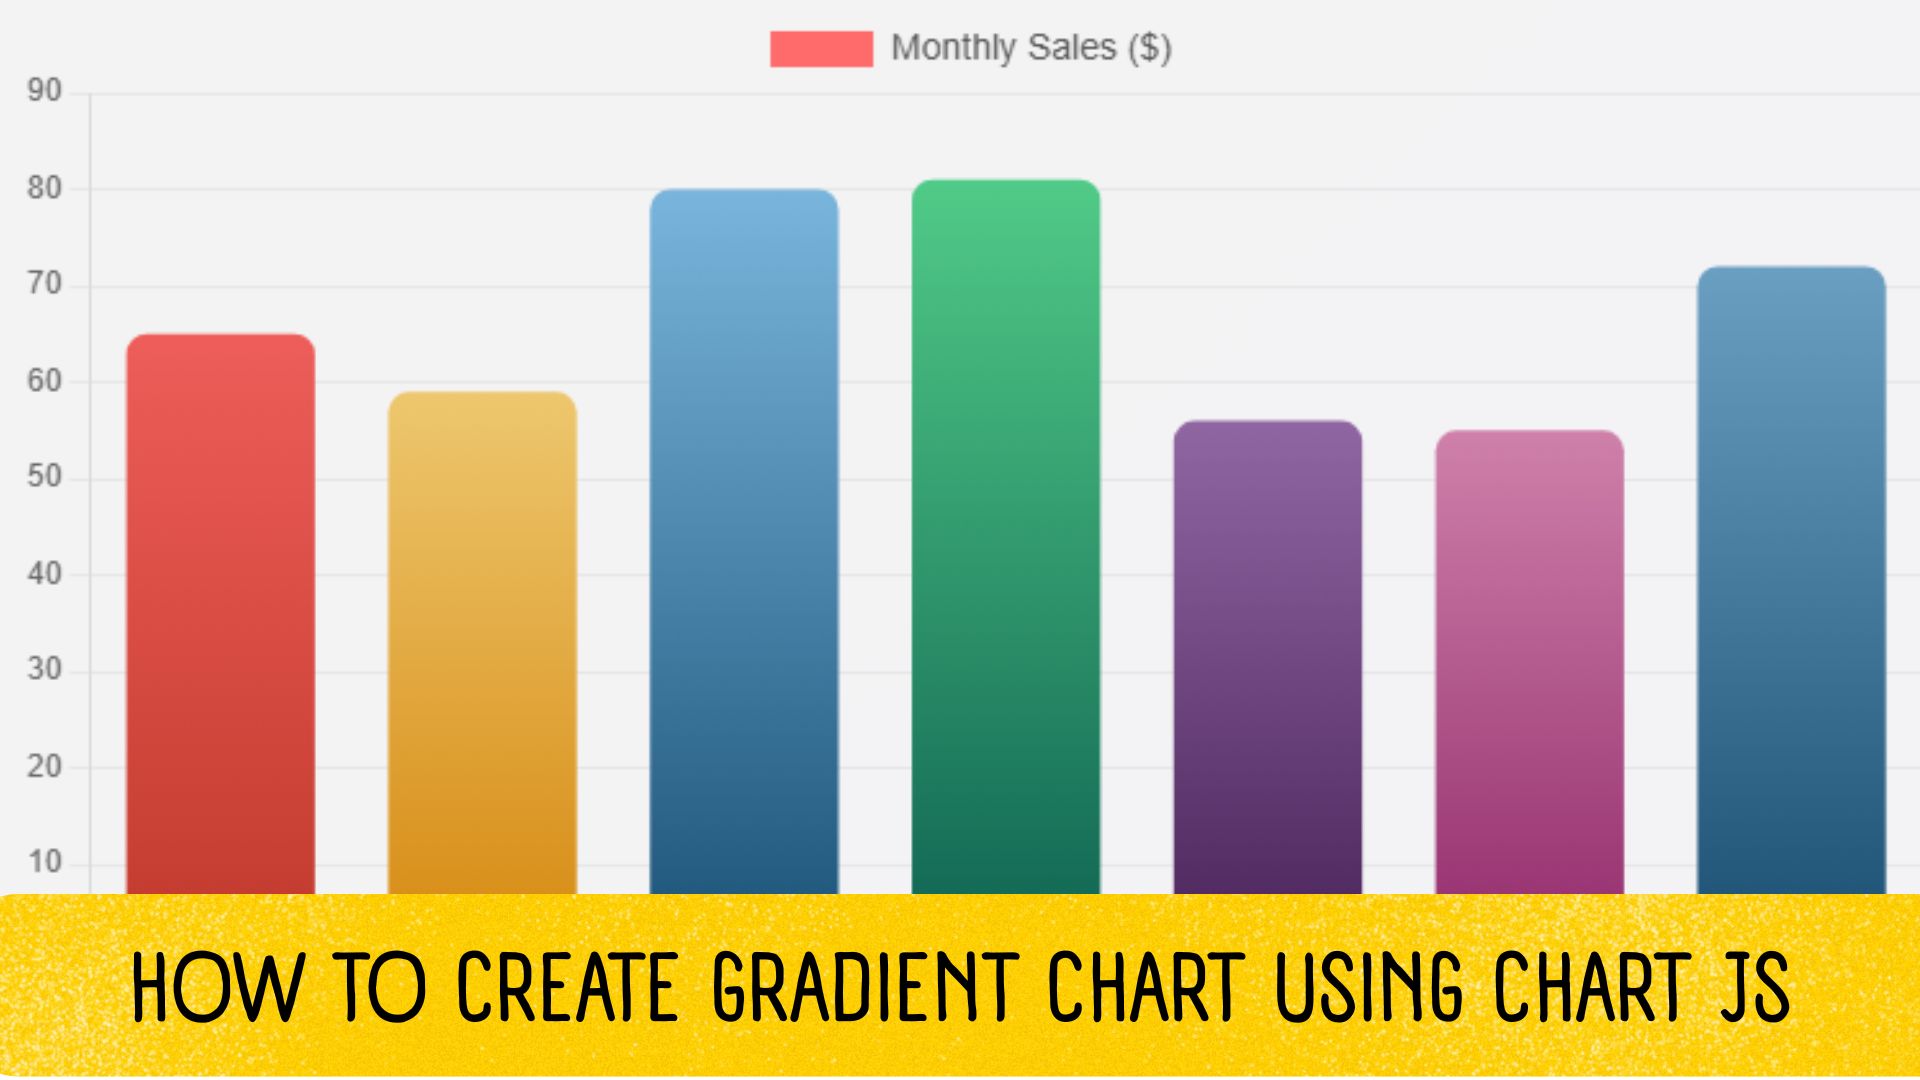
Today, I would like to share how to create a gradient bar chart using Chart.js. Chart.js is a popular JavaScript charting library used in many web applications.
First, add the CDN link as follows.
<script src="https://cdn.jsdelivr.net/npm/chart.js"></script>Next, add a canvas element to display the chart.
<canvas id="gradientChart"></canvas>In the script section, define a variable to reference the canvas element for the chart.
const ctx = document.getElementById('gradientChart').getContext('2d');Then, specify the gradient colors and implement a function to apply the gradient effect to the chart.
const gradientColors = [
            { start: '#c0392b', end: '#ff6b6b' },
            { start: '#d68910', end: '#f9e79f' },
            { start: '#1a5276', end: '#85c1e9' },
            { start: '#0e6251', end: '#58d68d' },
            { start: '#4a235a', end: '#bb8fce' },
            { start: '#922b6c', end: '#f5b7d1' },
            { start: '#1b4f72', end: '#7fb3d5' }
        ];

function getGradient(chart, dataIndex) {
            const { ctx, chartArea } = chart;

            if (!chartArea) {
                return gradientColors[dataIndex].start;
            }

            const colors = gradientColors[dataIndex];
            const gradient = ctx.createLinearGradient(0, chartArea.bottom, 0, chartArea.top);
            gradient.addColorStop(0, colors.start);
            gradient.addColorStop(1, colors.end);
            return gradient;
        }
After that, define the chart configuration as shown below.
        function getChartConfig(withAnimation) {
            return {
                type: 'bar',
                data: {
                    labels: ['January', 'February', 'March', 'April', 'May', 'June', 'July'],
                    datasets: [{
                        label: 'Monthly Sales ($)',
                        data: [65, 59, 80, 81, 56, 55, 72],
                        borderWidth: 0,
                        borderRadius: 8,
                        borderSkipped: false,
                        backgroundColor: function(context) {
                            const chart = context.chart;
                            const { ctx, chartArea } = chart;

                            if (!chartArea) {
                                return null;
                            }

                            const dataIndex = context.dataIndex;
                            const colors = gradientColors[dataIndex];
                            const gradient = ctx.createLinearGradient(0, chartArea.bottom, 0, chartArea.top);
                            gradient.addColorStop(0, colors.start);
                            gradient.addColorStop(1, colors.end);
                            return gradient;
                        }
                    }]
                },
                options: {
                    responsive: true,
                    maintainAspectRatio: false,
                    animation: withAnimation ? {
                        duration: 1500,
                        easing: 'easeOutQuart'
                    } : false,
                    plugins: {
                        legend: {
                            display: true,
                            labels: {
                                font: {
                                    size: 14,
                                    weight: '500'
                                },
                                color: '#555'
                            }
                        },
                        tooltip: {
                            backgroundColor: 'rgba(0, 0, 0, 0.8)',
                            titleFont: { size: 14 },
                            bodyFont: { size: 13 },
                            padding: 12,
                            cornerRadius: 8
                        }
                    },
                    scales: {
                        x: {
                            grid: {
                                display: false
                            },
                            ticks: {
                                font: {
                                    size: 12
                                },
                                color: '#666'
                            }
                        },
                        y: {
                            beginAtZero: true,
                            grid: {
                                color: 'rgba(0, 0, 0, 0.05)'
                            },
                            ticks: {
                                font: {
                                    size: 12
                                },
                                color: '#666'
                            }
                        }
                    }
                }
            };
        }

        // Create chart
        let myChart = new Chart(ctx, getChartConfig(true));
In this tutorial, we learned how to create a gradient bar chart using Chart.js, from adding the CDN and canvas element to configuring gradients and chart settings. You can customize the colors and data further to match your project requirements.